

Make no mistake about it, Sandy has and will continue to shut down a good part of the United States and for a very long time to come… It is hard to count the number of alarming reports coming from experts warning of complete devastation. An example of one such calamity brewing is salty water that is pouring into train tunnels and corrupting the third rail which would effect the entire NYC subway system… Power is expected to be out in many, many parts of the U.S. for weeks and maybe months.
SHOCKING HOBOKEN SUBWAY FLOODING PHOTO
|
Advertisement |
ALERT: FDNY REPORTS THICK SMOKE RISING FROM SUBWAY STREET GRATINGS!!

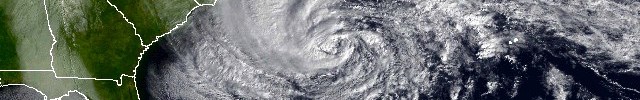
Dr. Jeff Masters from WunderBlog had this to say about the now historical storm,
The final countdown to Hurricane Sandy’s arrival has begun, and this extraordinary and historic storm is already causing havoc all along the U.S. coast from North Carolina to Massachusetts. The scale of this massive storm truly earns Sandy the title of “superstorm”. Sandy’s tropical storm-force winds span an area of ocean 940 miles in diameter, and both North Carolina and the island of Bermuda, 700 miles to the east, are under tropical storm warnings. The region of ocean covered by 12-foot high seas spans an area of ocean an incredible 1560 miles in diameter. Winds near hurricane force are expected to affect waters from Virginia to Massachusetts today. Record storm surge flooding has already occurred in regions along the New Jersey coast this morning, and the highest water levels recorded in over a century of record keeping are expected over much of the New Jersey and New York coasts this evening during the 8 – 9 pm EDT high tide cycle. Sandy brought sustained winds of 60 mph and waves 30 feet high early this morning to the buoy east of Cape Hatteras, NC. A wind gust of 58 mph occurred at New York City’s La Guardia Airport at 9:51 am EDT, and a buoy at Robins Reef, NJ recorded sustained winds of 42 mph, gusting to 55 mph. As of 8 am EDT, Sandy has dumped heavy rains of 7.87″ at Cape Hatteras, NC; 4.01″ at Ocean City, MD; 3.12″ at Dover, DE; and 3.22″ at Virginia Beach, VA. As of 9 am EDT, peak storm surge values of 5″ were observed at Lewes, Delaware, 4.2′ at Cape May, NJ, 4′ at Atlantic City, NJ, 2.9′ at Philadelphia, and 3.9′ at New York City.
Latest data from the Hurricane Hunters shows that Sandy is intensifying as its core traverses the warm waters of the Gulf Stream. At 8 am EDT, an Air Force hurricane hunter aircraft found top winds of 98 mph in the heavy thunderstorms to the southwest of Sandy’s center, at a point about 150 miles east-northeast of Cape Hatteras, NC. A dropsonde released in the eye measured a central pressure of 945 mb, but observed winds of 19 knots at the surface, so Sandy is probably a 943 mb hurricane that is very close to Category 2 strength. The Hurricane Hunters did not observe an eyewall, and saw very little temperature difference from inside to outside the eye, so Sandy is not going to be able to undergo rapid intensification. The storm could still see an increase of 5 mph in its winds before landfall tonight between 6 pm – 10 pm EDT, due, in part, to interaction with the low pressure system to its west that is pulling the hurricane towards the coast. The new, higher winds of Sandy don’t have a lot of time to pile up additional storm surge water, so the NHC storm surge forecasts will probably not change today. But it is clear that Sandy is not going to pull its punch, and this superstorm is going to deliver a punishing multi-billion dollar blow to a huge area of the Eastern U.S.
Sandy already producing a record storm surge
The National Weather Service in Atlantic City, NJ said that isolated record storm surge flooding already occurred along portions of the New Jersey coast with this morning’s 7:30 am EDT high tide cycle. As the tide goes out late this morning and this afternoon, water levels will fall, since the difference in water levels between low tide and high tide is about 5′. However, this evening, as the core of Sandy moves ashore, the storm will carry with it a gigantic bulge of water that will raise waters levels to the highest storm tides ever seen in over a century of record keeping, along much of the coastline of New Jersey and New York. The peak danger will be between 7 pm – 10 pm, when storm surge rides in on top of the high tide. The full moon is today, which means astronomical high tide will be about 5% higher than the average high tide for the month, adding another 2 – 3″ to water levels. This morning’s 9:30 am EDT H*Wind analysis from NOAA’s Hurricane Research Division put the destructive potential of Sandy’s winds at a modest 2.9 on a scale of 0 to 6. However, the destructive potential of the storm surge was record high: 5.8 on a scale of 0 to 6. This is a higher destructive potential than any hurricane observed since 1969, including Category 5 storms like Katrina, Rita, Wilma, Camille, and Andrew. The previous highest destructive potential for storm surge was 5.6 on a scale of 0 to 6, set during Hurricane Isabel of 2003. Sandy’s storm surge will be capable of overtopping the flood walls in Manhattan, which are only five feet above mean sea level. On August 28, 2011, Tropical Storm Irene brought a storm surge of 4.13′ and a storm tide of 9.5′ above MLLW to Battery Park on the south side of Manhattan. The waters poured over the flood walls into Lower Manhattan, but came 8 – 12″ shy of being able to flood the New York City subway system. According to the latest storm surge forecast for NYC from NHC, Sandy’s storm surge is expected to be 10 – 12′ above MLLW. Since a storm tide of 10.5′ is needed to flood the subway system, it appears likely that portions of the NYC subway system will flood. The record highest storm tide at The Battery was 10.5′, set on September 15, 1960, during Hurricane Donna.Figure 2. Observed storm tide (red line) and predicted storm surge for Hurricane Sandy at The Battery on the south shore of Manhattan, New York City, from the experimental Extratropical Storm Surge model, run by NOAA”s Meteorological Development Laboratory (green line) and the NYHOPS model from the Stevens Institute of Technology (pink curve), which uses a highly detailed 3D ocean model and even includes rainfall and tributary inflows. These models have a storm surge of 5 – 6′, which brings the maximum storm tide–the water level reached as a result of the combined action of the tide and the storm surge–to 11′ above MLLW (Mean Lower Low Water.) Irene brought a storm tide of 9.5′ above MLLW to The Battery in 2011. At a storm tide of 10.5′, water will likely pour into the Lower Manhattan subway system, unless efforts to sandbag the entrances are successful. The NWS in NYC is predicting a 10 – 12′ storm tide at The Battery during tonight’s 9 pm high tide cycle.
Figure 3. Observed storm tide (red line) and predicted storm surge for Hurricane Sandy at Atlantic City, New Jersey, from the experimental Extratropical Storm Surge model, run by NOAA”s Meteorological Development Laboratory (green line) and the NYHOPS model from the Stevens Institute of Technology (pink curve), which uses a highly detailed 3D ocean model and even includes rainfall and tributary inflows. These models predict a maximum storm tide–the water level reached as a result of the combined action of the tide and the storm surge–of ‘ above MLLW (Mean Lower Low Water.) Irene brought a storm tide of 9.5′ above MLLW to The Battery in 2011. At a storm tide of 10.5′, water will likely pour into the Lower Manhattan subway system, unless efforts to sandbag the entrances are successful. The NWS in Atlantic City is predicting a 9.5’ storm tide for the city during tonight’s 8 pm high tide cycle, which would be the highest water levels ever observed in Atlantic City.
To find out if you need to evacuate, please contact your local emergency management office. They will have the latest information. People living in New York City can find their evacuation zone here or use this map. FEMA has information on preparing for hurricanes.
People with disabilities and caregivers seeking information on accessible shelter and transportation can contact portlight.org
Atlantic City beach cam
Ocean City, MD webcam
Statue of Liberty cam
An impressive 1-minute resolution satellite loop of Sandy today is at the CSU RAMMB website.
Our Weather Historian, Christopher C. Burt, has an excellent post on Late Season Tropical Storms that have affected the U.S. north of Hatteras. He also has a post, Historic Hurricanes from New Jersey to New England.
Hurricane Sandy info from NASA.
Joe Romm at climateprogress.org has a thoughtful piece called, How Does Global Warming Make Hurricanes Like Irene More Destructive?
For those of you wanting to know your odds of receiving hurricane force or tropical storm force winds, I recommend the NHC wind probability product.
Wunderground has detailed storm surge maps for the U.S. coast.
The National Hurricane Center’s Interactive Storm Surge RIsk Map, which allows one to pick a particular Category hurricane and zoom in, is a good source of storm surge risk information.
Storm Surge prediction model from the Stevens Institute of Technology, which use a highly detailed 3D ocean model and even includes rainfall and tributary inflows.
Research storm surge model run by SUNY Stonybrook for New York City.
Climate Central has a nice satellite image showing which parts of New York Harbor are below five feet in elevation.
I’ll have an update this afternoon.
Jeff Masters
